Analyzing R package trends and adoption of new technologies by the R community
Introduction
Ever wondered how a certain technology is adopted by the R users' community?
Ever wanted to know how a specific package is downloaded in different countries, or during different periods?
In order to answer those questions and similar ones, I've created the rtrends package.
This package is inspired by Google Trends tool, which allows you to search and compare various terms and displays results throughout periods of time and at varying geographic locations.
The rtrends package has several functions, of which the most important one (in my opinion) is cran_stats_by_packages, which allows you to get CRAN information downloads (based on RStudio mirror site logs) for a range of dates and for a list of packages.
This functionality is quite similar to the one offered by Google Trends for comparing search trends and patterns concerning different terms.
One of the advantages of rtrends package is that it enables you to understand how certain technologies are implemented among R users (in contrast to Google trends, where you are not always sure if a specific search term relates to a specific technology or to some other unrelated issue).
Use Case
In order to test the package, and compare it with Google Trends, I downloaded information about three relatively new technologies, in an attempt to understand their rate of acceptance and usage among R users community.
The technologies I was interested in are: NEO4J (a native graph database), MongoDB (a NoSQL,document-oriented, database) and Spark (an open source cluster computing framework).
Each of those technologies has R APIs (in the form of packages) which enables communicating with them thru R platform.
Now, in order to make things more interesting, sometimes there is more than one R package for each DB/technology or at certain points in time, a package is deprecated and replaced by new ones.
Below is a list of packages connected to each of the analyzed databases/technologies:
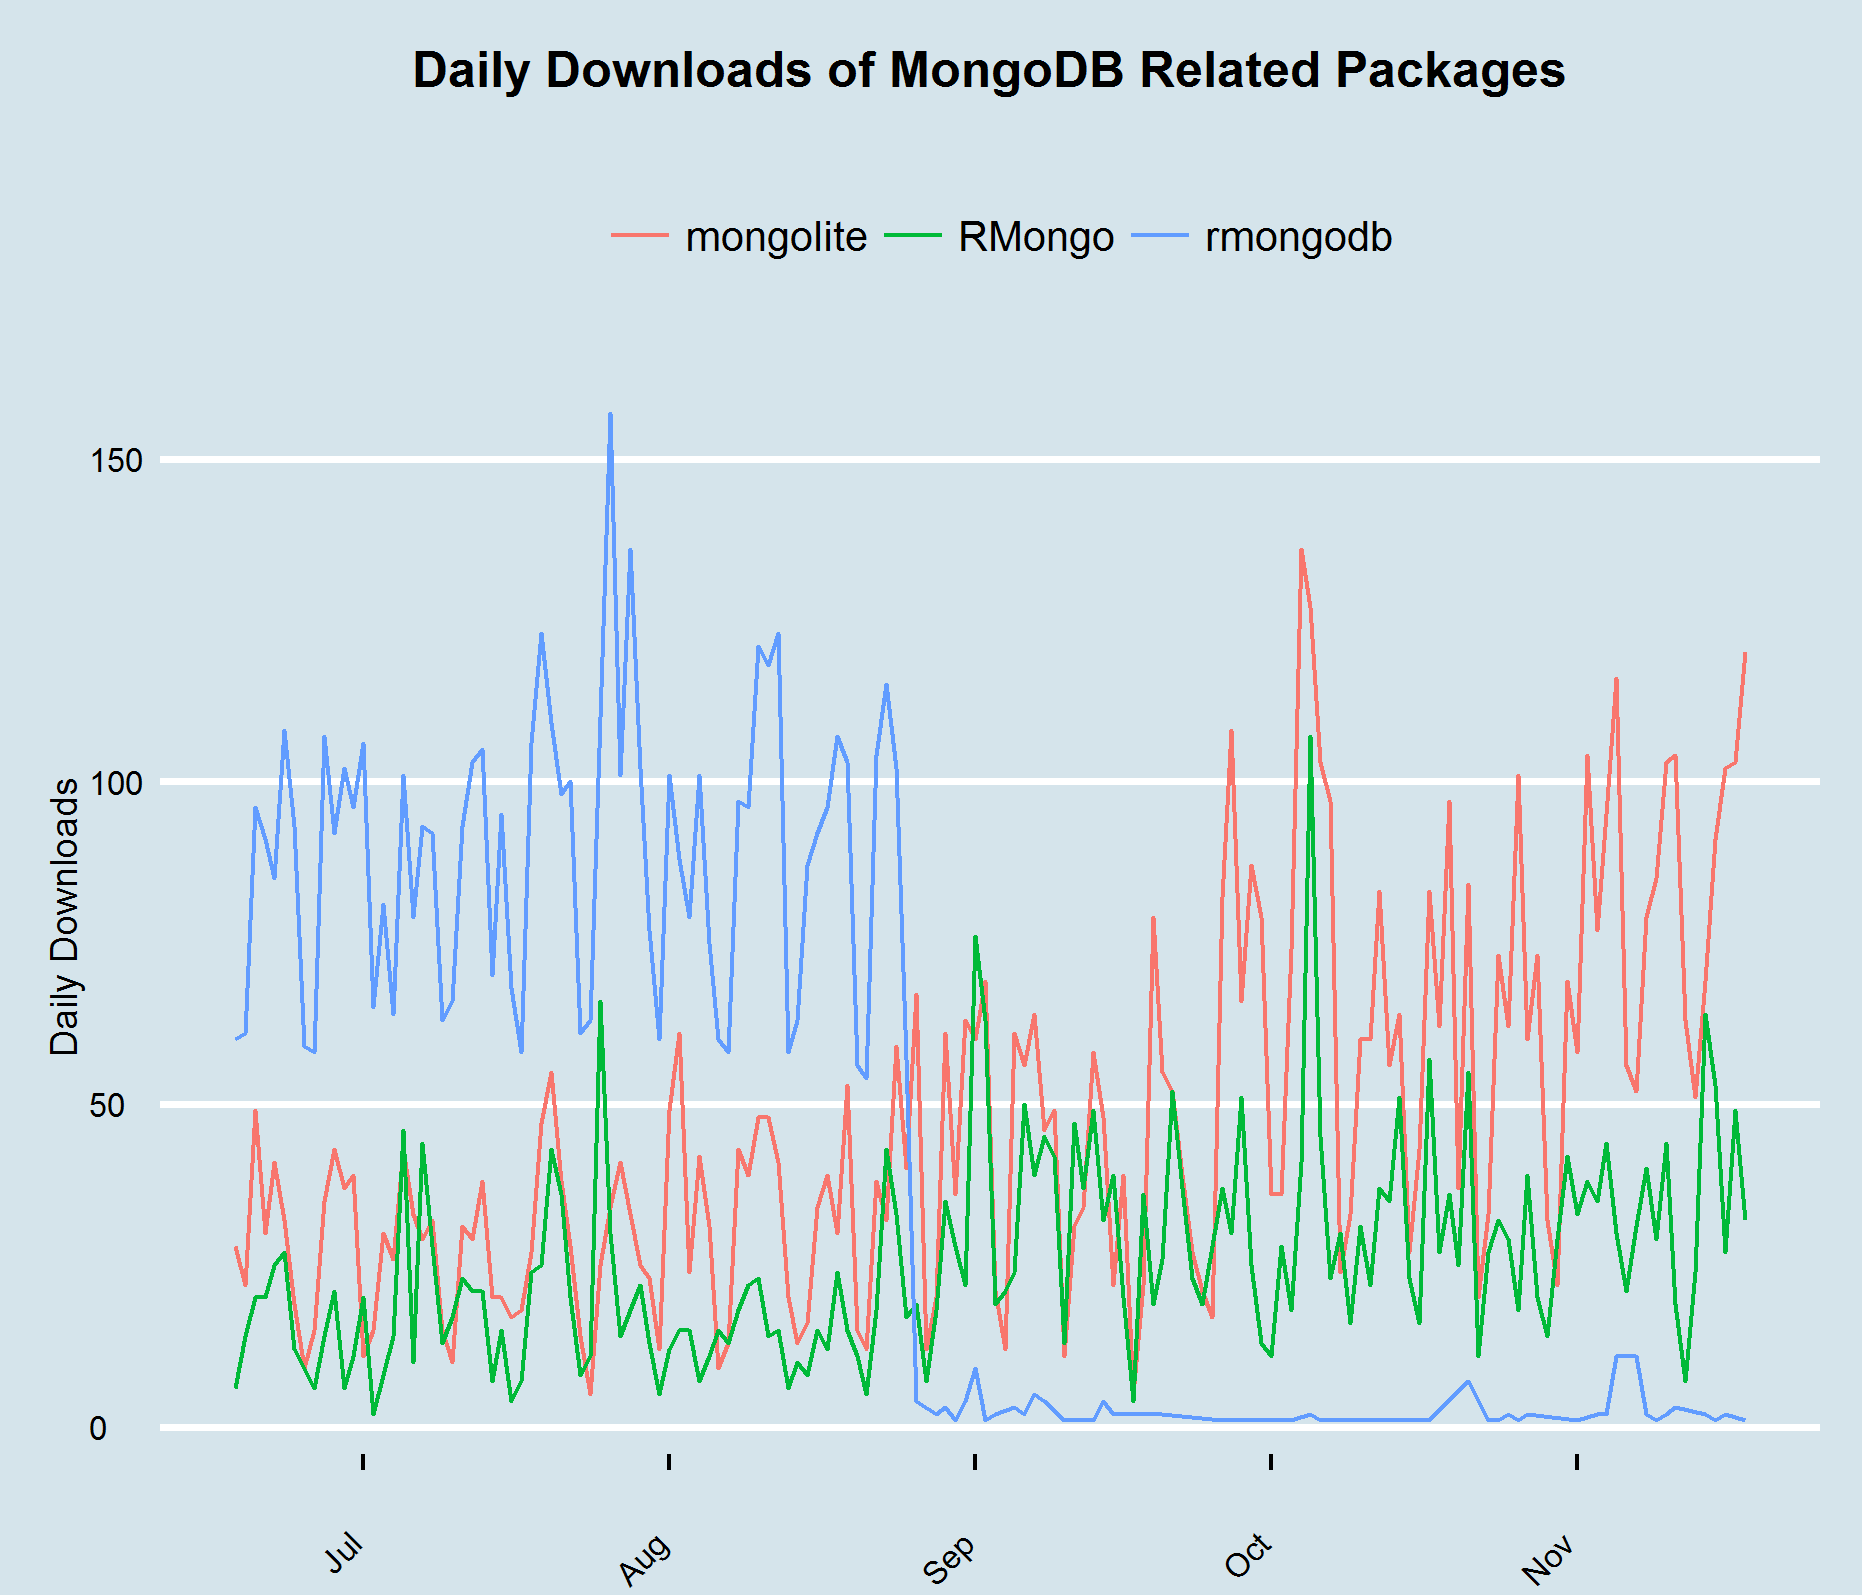
- MongoDB: Since this is the most ‘veteran' technology, it has (or had) three different R packages:
- NEO4J:
- RNeo4j: The R driver for interacting with a NEO4J DB.
- Spark:
- sparklyr: An R interface for Apache Spark, based on dplyr syntax.
(Note: there is also an older package –sparkR – but since it is not on CRAN, it cannot be measured.)
The analysis of trends is based on a period of five months, ranging from July 18, 2016 thru November 18, 2016.
I also used Google Trends in order to analyze and compare the trends as they are reflected by both methodologies.
According to Google trends plot, MongoDB is by far the most frequently searched (and thus popular?) technology of the three compared.
It looks like the trends are quite stable, meaning that each technology/database keeps its 'status quo' in relation to the others.
Also, an interesting pattern is the weekly drops in searches, meaning that those terms are searched mainly during workdays and are less searched on weekends.

In order to make a similar comparison based on downloads from RStudio CRAN mirror, first I united the three MongoDB R packages into one term.
Evidently, since its upload to CRAN on September 24 2016, sparklyr seems to be 'on steroids': compared to Google Trends, it is downloaded more than three times more often than all the other packages combinded.
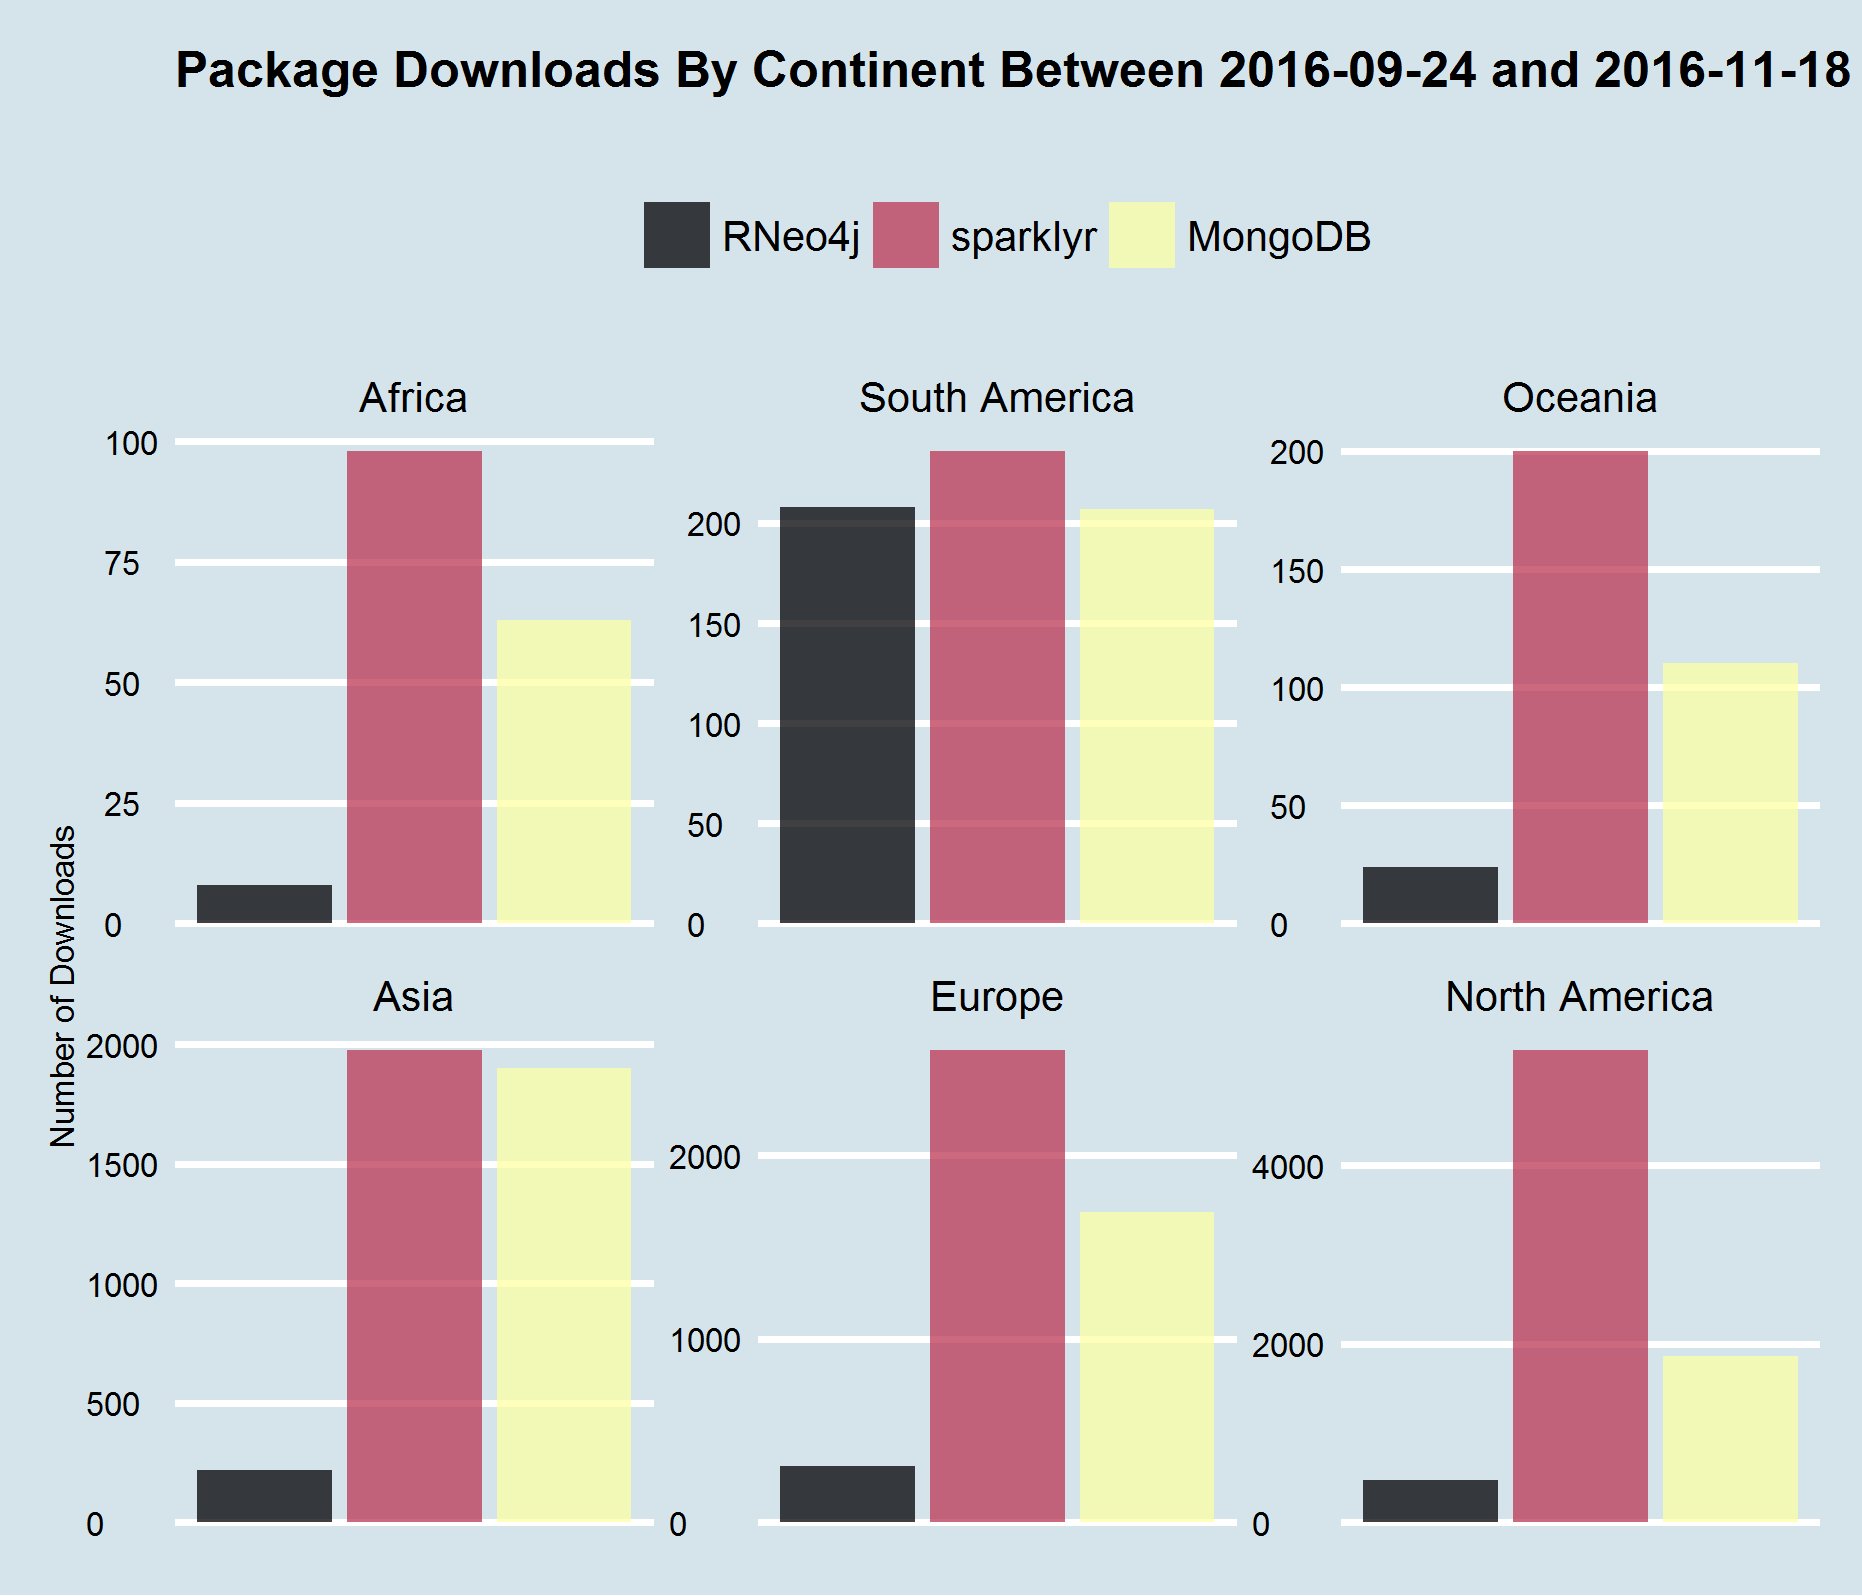
A comparison of the distribution of downloads by continent, which does not take into account population size, shows that it is North America and Europe that set the general trends (since most of the downlaods occur in those locations). However, when isolating the information by different continents, the following becomes evident:
- In Asia there is an almost similar interest in MongoDB and Spark related packages
- In South America, there is equal interest in all three technologies (of course, since the numbers are relatively low, they may reflect usage of those packages by educational institutions, for example).
Conclusion
Each of those tools may create a different picture of reality.
Google Trends creates a picture where the popularity of those three technologies remains quite stable throughout time.
On the other hand, we get quite a different picture of the same technologies, based on the rate at which they are adopted by the R users' community, as reflected in RStudio CRAN download logs.