Social Network Analysis
Finding the most socially-important users on Yelp dataset
Introduction
The cliché says that the world is an increasingly interconnected place, and the connections between different entities are often best represented with a graph.
The purpose of this project is implementing several SNA (Social Network Analysis) techniques and algorithms on Yelp datasets , in order to gain some insights related to 'importance' of users in Yelp's network.
Question
Ever wondered who is the most influential user in a specific network? Who is that person, assuming that you have to pick just one, is the most valuable in that social network?
As stated in the introduction, the purpose of this analysis is trying to answer to that question by applying tools used in the world of graph databases.
There is more than one answer to the question, and different methodologies can be implemented in that inquiry, so the following analysis is just one out of many, rendering a specific output out of several possible ones.
Analysis
The Datasets
The sources of data I've used are based on 3 Yelp datasets: 'users', 'business' and 'reviews'.
In order to create a network of users and friendships, I 'normalized' the users' datasets, creating a 'long-formatted' list of friends for each user (since the original format was wide-formatted, e.g. each user has an array of related friends).
Filtering businesses and related users
The whose dataset of users has more than 680,000 users, and the 'long' dataset of users-friends (e.g. a dataset with two rows: a user and all his 'friends'), has more than 4 million rows…
Making analysis on the whole datasets is quite resource-demanding (CPU, memory, etc.), so the first part of the analysis concentrates in the reduction of those datasets:
Step 1: Since the central 'entity' around which the whole Yelp's platform works is the business, I started the analysis by summarizing the number of reviews each business has, and then picking the ones with higher numbers, since I assume they are the most popular ones.
For sake of simplicity, I set a threshold of 100 first most reviewed restaurants for the next step of the analysis.
Below is a list of the 10 most reviewed restaurants and a histogram showing the distribution of reviews among the top 100 most reviewed restaurants
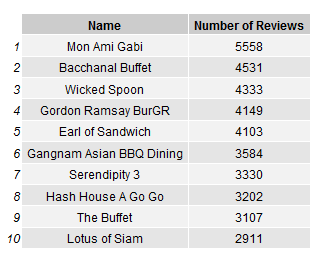
Table of Top Reviewed Restaurants
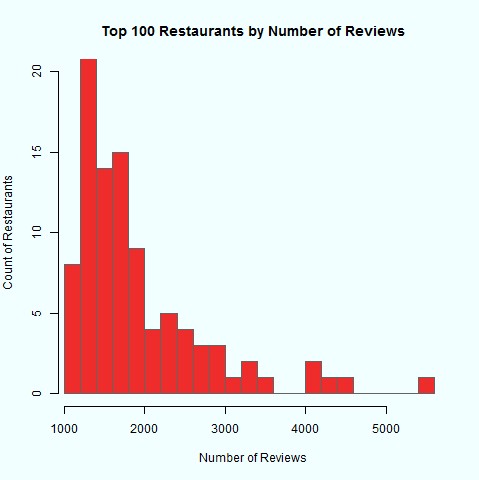
Step 2: Having a list of 100 businesses (restaurants) with highest number of reviews by different users is not enough, so the second step is summarizing, out of that list, the ones with the highest number of users with friends. This is very important on Yelp's datasets, since only 43% of the users on the dataset have at least one friend.
Out of the 100 restaurants, only 36 of them have at least 30% of 'friendly reviewers' (e.g. users that gave review to that restaurant and that have at least one friend on Yelp's dataset).
Step 3: Now that I managed to isolate the top 36 restaurant with friendly reviewers, the next step will end the preparations stage: I'll isolate all those users involved on those reviews, in order to start the SNA stage.
Let's see who are the 'friendly users' that gave the highest number of reviews to those 36 restaurants: 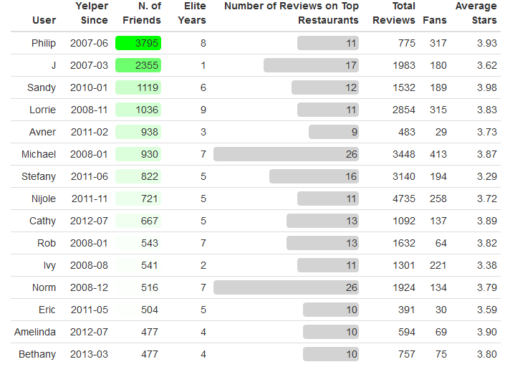
Analysis of the Social Network
Now that I isolated a list of users from the most reviewed restaurants, I'll start this Social Network Analysis with some descriptive statistics.
Side by side with the analysis, I'll explain key concepts related to the analysis of social networks.
The analysis is performed using 'igraph' R package, which is the package for SNA.
For a detailed documentation, please refer to igraph oficial site'
The basic logic
One possible approach for this analysis would be creating a unified dataset of users and friends involved in the review of the top restaurants, and then finding the most central one.
An alternative approach, which I'm in fact implementing, is handling each restaurant as an isolated network of users: with this approach, I'm measuring the importance of each user for each restaurant, and then combining the data in order to see if there is a potential user that outstands as important for most of those networks.
So, prior to the creation of a graph dataset, I need to create a list of users (that reviewed each of the selected 36 restaurants), and their friends.
Each such list is the input to the graph analysis…
For simplicity of explanation, I'll take just one business ('Delmonico Steakhouse') and detail it's network-related features. A summary list is appended at the end of this section.
Creating the graph data frame:
1 | Y_graph <- graph.data.frame(friends_b1,directed = FALSE,vertices = users_vertices) |
Since the relation between user and friend is bidirectional (e.g. if A is friend of B, then B is always friend of A), the graph is not directed (thus the parameter directed=FALSE)
Descriptive statistics
Graphs are comprised of vertices (also often called 'nodes') and edges connecting those nodes, thus nodes and edges represent the basic entities on a graph database.
Now that we finally have a list of users and friends, we are ready to go…So we will start with some graph statistics in order to get acquainted with our network.
1 2 3 4 5 | vcounts <- vcount(Y_graph); ecounts <- ecount(Y_graph) vcounts;ecounts 10197 14503 |
The number of users in this network that we just created is 10197 and the number of relationships between those users is 14503.
Thus, we can say that the average number of friends per user in this network is about 1.4
In graph theory, the degree of a vertex of a graph is the number of edges incident to the vertex.
We can now get a list of degrees (edges connected directly to each node) of all the nodes:
1 | degree(Y_graph) |
and plot it to get an idea of the degree's distribution:
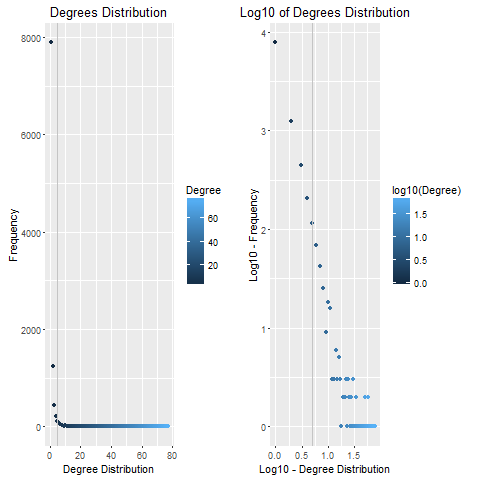
As we can see (and as we assumed from the relation between number of nodes and edges), the vast majority of nodes have only 1 or 2 friends).
Another interesting measure is the diameter of the network:
diameter(Y_graph) 9 |
In our case, the largest shortest-path between two users is 9, meaning that at the maximum, we need 7 additional connected friends in order to connect between two users.
Also, we can get the 'names' of those users:
1 2 3 4 | farthest_users <- farthest.nodes(Y_graph,directed = F)$vertices farthest_users[[1]]$user_name; farthest_users[[2]]$user_name [1] "Dorothy" [1] "Jess" |
The density of a graph is the ratio between the number of edges and the number of possible edges.
Another statistic, of which we can assume more or less its value, is the network density (e.g. how connected is the network in relation to the maximum possible connectivity)
The density in the current network is calculated as follow:
1 2 | graphDensity <- graph.density(Y_graph) 0.000278988 |
This is a really low value, hence rectifying our prior knowledge about the ratio of edges per node.
A final descriptive statistic is the Average degree of the neighbors of a given vertex
Beyond the degree distribution itself, it can be interesting to understand the manner in which vertices of different degrees are linked with each other.
Useful in assessing this characteristic is the notion of the average degree of the
neighbors of a given vertex.
For example, a plot of average neighbor degree versus vertex degree, suggests that while there is a tendency for vertices of higher degrees to link with similar vertices, vertices of lower degree tend to link with vertices of both lower and higher degrees'.
1 2 3 4 5 6 | knn.deg.g <- graph.knn(Y_graph,V(Y_graph))$knn degree.g <- degree(Y_graph) degrees_table <- as.data.frame(table(degree.g)) names(degrees_table) <- c("Degree","Frequency") row.names(degrees_table) <- NULL degrees_table$Degree <- as.integer(degrees_table$Degree) |
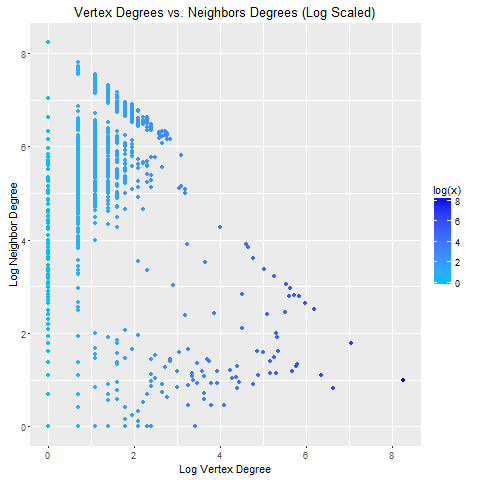
It looks like there are many nodes in this network with low degree's numbers but connected to high-degree neighbors.
Vertex/Edge centrality
Now that we have a more precise idea about the general 'look and feel' of each network, let's advance to the next stage: measuring centrality of nodes and edges
In graph theory, there are three main ways of measuring the centrality of a vertex: closeness, betweeness and eigenvector centrality.
Since 'betweeness' is usually a good descriptor of centrality in relation to flow of data, I'll concentrate the analysis of centrality upon this measure.
In addition, a well-known measure of edge centrality is the edge-betweeness.
The vertex and edge betweeness are (roughly) defined by the number of shortest paths going through a vertex or an edge.
So, the next step in this query is finding which 'selected' users are also rated high according to 'node betweeness'.
1 | btw_grade <- betweenness(Y_graph) |
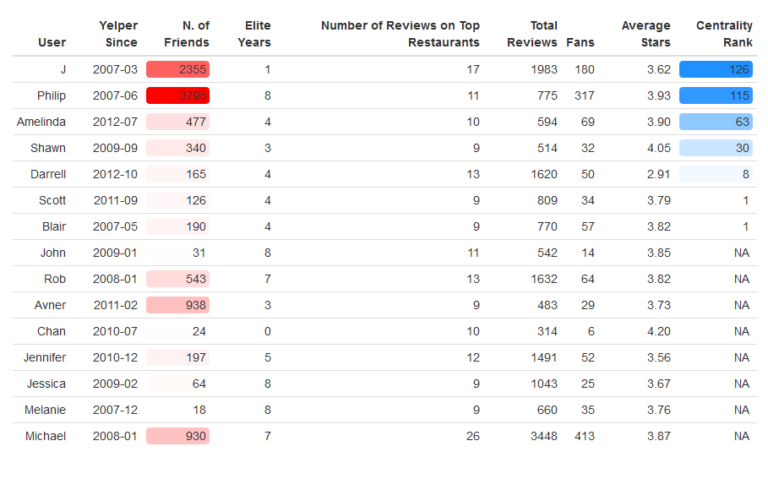
For each business network, I then rank the top 10 users according to their betweeness score, and then summarize the ranks of each user in all the networks.
The results are quite interesting...
Results
As one might have expected, in low-density networks, users with high number of friends tend to be the more central ones.
However, although the top 2 users are both the most 'friendly' ones and the most central ones (however, in opposite order), for the other ones, this is not the case: users with lower number of friends are found to be more central, in average, one considering their centrality upon the 36 different networks of the selected restaurants.